Look at a longer timeframe to give a new perspective.
So, just two days ago I wrote: “Stop waiting for the perfect moment“, noting that I had a large sum of money from the sale of a house (in USD) to move to buy a house in the UK (in GBP) and that since the USD arrived in my UK account the rate had moved from 1.23 to 1.28, so “costing” me “a lot of money” by waiting for the perfect moment.
Well, the learning moment continues, as I still haven’t “pulled the trigger” on exchanging my USD to GBP and the rate has continued to move upwards, now at 1.30. Ah well.
Yesterday, though, I was recounting a story to make a point about timeframes altering perspective, a story from fifteen years ago of looking to enable a large tourism resort development in Scotland.
On that occasion, after touring the site at the edge of the Highlands with the owner, I realised that, after years of searches, I had found a perfect site and both I and the property owner seemed really keen to get started.
However, when I asked the owner when they felt we could start (knowing they’d have to pay to cease a quarrying contract to begin the process of turning the quarry site into golf course and a resort), they said: “in about thirty years, when the quarrying licence is complete”.
You see, their family had owned the many thousands of acres of land for over 900 years, so thirty years to them was a mere blip.
This was a huge learning experience for me, yet today I find I still have not fully learned this, staring obsessively at live GBP-USD FX charts. So, what new lesson from this can I share today?
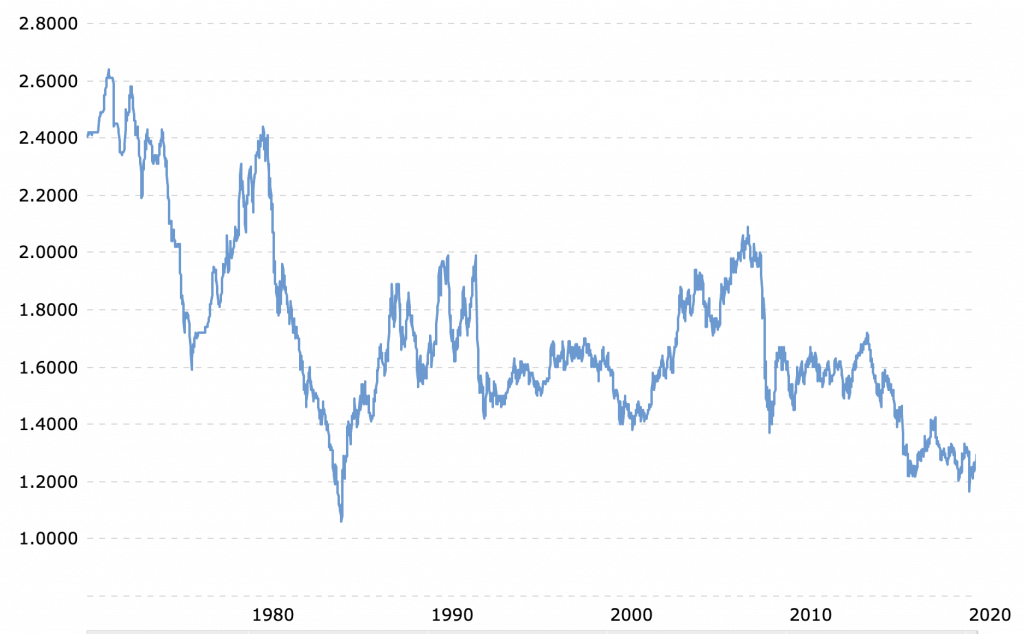
Well, in an attempt to look at a longer timeframe to give perspective, I have considered that the funds I am holding in USD are the result of investing in property for over thirty years, so I then pulled up a historical GBP-USD chart (above).
This chart goes back 50 years. When I glance at it, the first thing to note is that the rate was mostly over 2.00 throughout the 1970s. I then look back to 1988 (when I bought my first apartment) and the rate was around 1.60. I then see that the rate largely moved around the 1.50 range until around the time of the Brexit vote in mid 2016, since when it has moved around the 1.30 rate.
So, yes it was 1.25 when I moved my funds to the UK a few weeks ago and I feel it is “costing” me “a lot of money” now that is is around 1.30, yet when I look at a longer perspective, perhaps I can recognise that 1.30 is a great rate for me compared to convert funds I earned and invested in USD while living in various homes in the Cayman Islands between 1989 and 2017. Far better than 1.50 or even higher.
Right, time to “pull the trigger”.
Oh, and, fifteen years having passed, perhaps I might get back in touch with that property owner and see if they are ready to start yet.